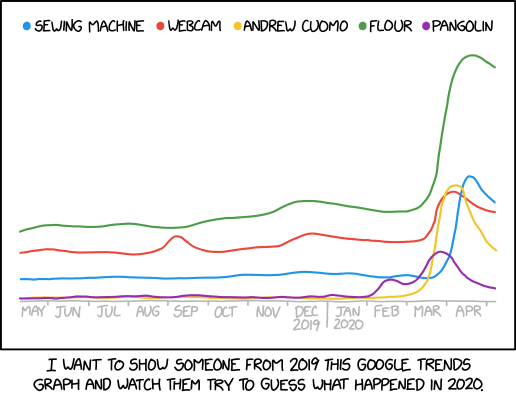
I have long been a fan of xkcd comics and this one inspired a history idea. After showing students this graph of Google trends, have them create their own graphs based on historical events and then they can trade graphs to guess each other’s events. The process is fairly simple and this could be a fun review for students.
Student Steps
- Choose an important historical event or for a greater challenge, an obscure one.
- Brainstorm 4-6 key words that people would have Googled if the internet had existed back then. Be creative and fun, but not too tricky.
- Sketch out line graphs of trends for the keywords. Use colored pencils and paper. No need for them to be fancy.
- The graph should have no y-axis. On the x-axis, have students write months, but not the year (to make it challenging).
- Once everyone has completed their graph, have students walk around and exchange graphs and guess the events. Each student can keep track of how many guessed correctly/incorrectly.
- For a fun variation, have students also give ridiculous answers too.
- Reflect on class favorites, best guessers, and the most creative ones.
- Variations could focus on historical individuals or peoples.
- For an online adaptation, have students sketch their graphs on an online whiteboard and share virtually in Google Meet or Zoom call.
Questions? Interested in SEL and PBL Consulting? Connect with me at michaelkaechele.com or @mikekaechele onTwitter.
